My research focuses on high-resolution MRI and the mapping of brain function using functional MRI. One research line is focused on the benefits and challenges associated with the use of ultra-high field MRI (7T). In addition, I am also working on the development of functional MRI techniques, which in turn can be used to map brain functions. Finally, I conduct research into imaging of the human cerebellum: how can we use both anatomical and functional MRI to learn more about this fascinating brain structure?
Ultra-high field MRI
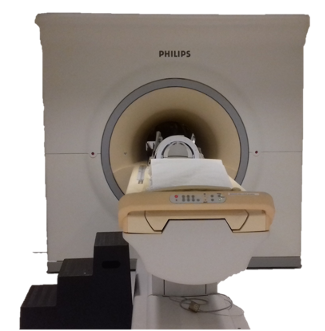
Ultra-high-field MRI is a research field that is developing rapidly, with increasingly larger and stronger magnets. At the Spinoza Centre we work with a 7T MRI system. We work on the improvement of signal detection with e.g. local receive coils (Priovoulos et al., 2021; Salomon et al., 2014), but are also pursuing sequence development to further improve detection power. An example is the acquisition of images with homogeneous contrast, even if the rf-pulses used to generate the signal are inhomogeneous (as is the case at 7T). For this purpose, we use the MP2RAGE sequence (Marques et al., 2010a), which we further improved by adding advanced rf-pulses (Oliveira et al., 2021). An extended, multi-echo version, MP2RAGEME (Multi-Echo) allows us to collect iron-sensitive T2* maps simultaneously with the myelin-sensitive T1 maps (Caan et al., 2019), saving acquisition time and preventing movement between scans. Both myelin and iron distributions are clinically relevant. We further improved the sharpness of the images with motion correction (Bazin et al., 2020).
In another MP2RAGE variant, we link the anatomical images to functional acquisitions, by including the susceptibility-induced distortions of the latter in the T1-weighted images (van der Zwaag et al., 2018a). That is especially useful if we have high-resolution functional datasets. We can then see exactly where the functional signal comes from, for example from the deeper or more superficial layers within the cerebral cortex.
Methods in this line: local receive coils, MP2RAGE, MP2RAGEME, motion correction and distortion-matched T1 maps.
Functional MRI
At 7T, MRI is extra sensitive to the activation-related changes in the brain measured in fMRI (van der Zwaag et al., 2009). We can therefore measure brain function more quickly or in more detail. My goal is to map the whole brain, including the cerebellum, while still being able to maintain the high spatial resolution. For this, we make extensive use of 3D-EPI (van der Zwaag et al., 2012). 3D-EPI is more efficient and can be faster than the 2D version, which makes it easier to cover the whole brain. In addition, special rf-pulses for a more homogeneous signal can easily be added (Narsude et al., 2016; van der Zwaag et al., 2018b). However, this method is also more sensitive to fluctuations such as breathing and heart rate, which can be addressed successfully with some care (Jorge et al., 2013) or by using faster acquisitions (Reynaud et al., 2017).
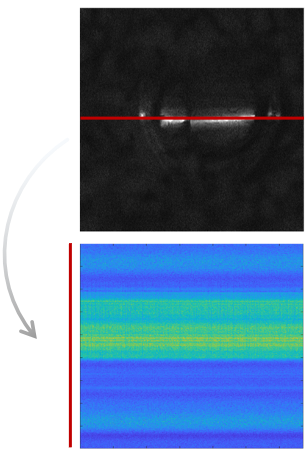
In line scanning (Raimondo et al., 2023a, 2023, 2021) we actually do the opposite: instead of measuring the whole brain, we only measure signal from one specific line through the brain. With this method we can acquire a line every 100 ms, and we get a lot of points along the line. This allows us to better estimate both the time and location of the functional response.
An important driver for the need for high resolution in functional MRI is the cortical morphology: Feedback and feedforward signals arise from different depths in specific responses. In BOLD-weighted imaging, the most widely-used contrast in fMRI, we see that the signal pools towards the cortical surface, as the venous blood drains in that direction. It is therefore hard to know exactly where the neuronal activation takes place based on the BOLD signal changes alone. There are however, alternative contrasts for fMRI. Two alternatives that I have worked on include Vascular-Space-Occupancy (VASO, (de Oliveira et al., 2022; Oliveira et al., 2022, 2020)) and Arterial Blood Contrast (ABC, Priovoulos et al., 2023). Both are more directly linked to the neuronal signal. Unfortunately, higher spatial specificity often comes at the price of lower sensitivity. I aim to find a solution that can offer both high specificity and high sensitivity.
Funding: in 2018, the Spinoza Centre was awarded a KNAW research grant to fund the linescanning project.
Maps in the brain
The brain is full of maps, the most famous of which is the motor homunculus, an orderly representation of our body parts in the brain, for example found in the motor and somatosensory cortices. But also our visual and auditory cortices contain maps of visual space or the tones in sound (Da Costa et al., 2011). Using 7T MRI, we can map these regions in individual participants in a relatively short time (Martuzzi et al., 2014). With 7T, we can also look at small areas within these maps (e.g. the feet: Akselrod et al., 2021) or manipulate the maps with a task (Martuzzi et al., 2015). I look for the unexplored areas in these maps.
For example, we have now started a collaboration with Erasmus MC in which we look at genitourinary areas (Groenendijk et al., 2020; Luijten et al., 2020). Together, we study how their representations fit into these body maps.
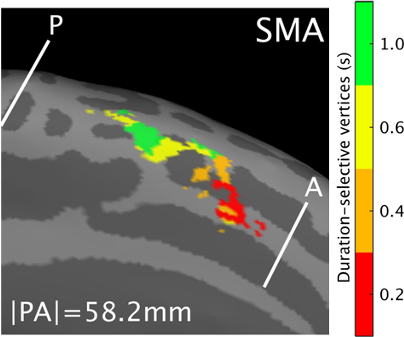
In addition, we look at maps that are not directly linked to sensory input, such as areas that respond to numbers (Cai et al., 2021) or durations, amounts of time, (Protopapa et al., 2019, Figure). The 7T comes in useful in these experiments too, because of its high BOLD sensitivity, as the responses to these type of stimulus are somewhat more subtle than sensory responses.
Collaboration: started with Erasmus MC, on genitourinary areas and how their representations fit into the body maps.
Cerebellum
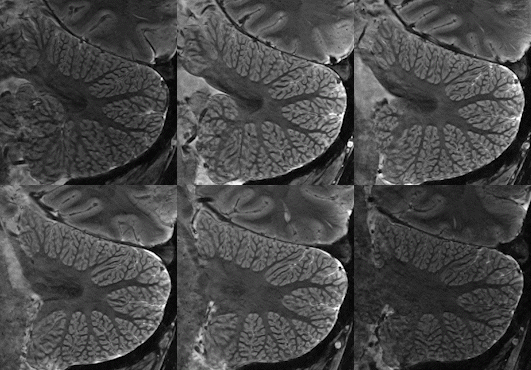
The strengths of 7T-MRI are essential when scanning the human cerebellum, also known as the ‘little brain’. This part of the brain has a very intricate structure, with a thin, highly folded cortex. Within this cortical ribbon lie three cell layers that, together, are less than a millimetre thick (Marques et al., 2010b). The high resolution offered by 7T-MRI now makes it possible to, for the first time, properly image the cerebellum with modern motion correction approaches (Priovoulos et al., 2023a, Figure).
Unfortunately, it is still common practice to scan only the cerebrum and ignore the cerebellum. This, while the cerebellum is important for a variety of brain functions, from learning motor skills to controlling your emotions. For example, the cerebellum also contains several homunculi, which we have also visualised in some detail using 7T MRI (Boillat et al.,2020; van der Zwaag et al., 2013). Damage to the cerebellum, as can occur in people with Multiple Sclerosis or spinocerebellar ataxia, can result in various motor and cognitive symptoms. A better understanding of cerebellar function is therefore important to understand disease progression.
Funding for this line
- 2014 Swiss National Science Foundation project grant, “Cerebellar somatotopy with ultra-high field fMRI”
- 2017 NWO Aspasia grant to the Spinoza Centre, for high-resolution fMRI of cerebellar function
- 2019 NWO Vidi grant, “New dimensions in human cerebellar MRI”
- 2026 NWO-TTW Vici grant, “Mesoscale MRI: a window on the functional subunits of the human cerebellum”
- Stichting MS Research, De rol van de kleine hersenen in MS
References
- Akselrod, M., Martuzzi, R., van der Zwaag, W., Blanke, O., Serino, A., 2021. Relation between palm and finger cortical representations in primary somatosensory cortex: A 7T fMRI study. Hum. Brain Mapp. 42, 2262–2277. https://doi.org/10.1002/hbm.25365
- Bazin, P.-L., Nijsse, H.E., van der Zwaag, W., Gallichan, D., Alkemade, A., Vos, F.M., Forstmann, B.U., Caan, M.W.A., 2020. Sharpness in motion corrected quantitative imaging at 7T. NeuroImage 222, 117227. https://doi.org/10.1016/j.neuroimage.2020.117227
- Boillat, Y., Bazin, P.-L., van der Zwaag, W., 2020. Whole-body somatotopic maps in the cerebellum revealed with 7T fMRI. NeuroImage 116624. https://doi.org/10.1016/j.neuroimage.2020.116624
- Caan, M.W.A., Bazin, P.-L., Marques, J.P., de Hollander, G., Dumoulin, S.O., van der Zwaag, W., 2019. MP2RAGEME: T1 , T2* , and QSM mapping in one sequence at 7 tesla. Hum. Brain Mapp. 40, 1786–1798. https://doi.org/10.1002/hbm.24490
- Cai, Y., Hofstetter, S., van der Zwaag, W., Zuiderbaan, W., Dumoulin, S.O., 2021. Individualized cognitive neuroscience needs 7T: Comparing numerosity maps at 3T and 7T MRI. NeuroImage 237, 118184. https://doi.org/10.1016/j.neuroimage.2021.118184
- Da Costa, S., van der Zwaag, W., Marques, J.P., Frackowiak, R.S.J., Clarke, S., Saenz, M., 2011. Human primary auditory cortex follows the shape of Heschl’s gyrus. J. Neurosci. Off. J. Soc. Neurosci. 31, 14067–14075. https://doi.org/10.1523/JNEUROSCI.2000-11.2011
- Groenendijk, I.M., Luijten, S.P.R., de Zeeuw, C.I., Holstege, J.C., Scheepe, J.R., van der Zwaag, W., Blok, B.F.M., 2020. Whole brain 7T-fMRI during pelvic floor muscle contraction in male subjects. Neurourol. Urodyn. 39, 382–392. https://doi.org/10.1002/nau.24218
- Jorge, J., Figueiredo, P., van der Zwaag, W., Marques, J.P., 2013. Signal fluctuations in fMRI data acquired with 2D-EPI and 3D-EPI at 7 Tesla. Magn. Reson. Imaging 31, 212–220. https://doi.org/10.1016/j.mri.2012.07.001
- Luijten, S.P.R., Groenendijk, I.M., Holstege, J.C., De Zeeuw, C.I., van der Zwaag, W., Blok, B.F.M., 2020. Single subject and group whole-brain fMRI mapping of male genital sensation at 7 Tesla. Sci. Rep. 10, 2487. https://doi.org/10.1038/s41598-020-58966-9
- Marques, J.P., Kober, T., Krueger, G., van der Zwaag, W., Van de Moortele, P.-F., Gruetter, R., 2010a. MP2RAGE, a self bias-field corrected sequence for improved segmentation and T1-mapping at high field. NeuroImage 49, 1271–1281. https://doi.org/10.1016/j.neuroimage.2009.10.002
- Marques, J.P., van der Zwaag, W., Granziera, C., Krueger, G., Gruetter, R., 2010b. Cerebellar cortical layers: in vivo visualization with structural high-field-strength MR imaging. Radiology 254, 942–948. https://doi.org/10.1148/radiol.09091136
- Martuzzi, R., van der Zwaag, W., Farthouat, J., Gruetter, R., Blanke, O., 2014. Human finger somatotopy in areas 3b, 1, and 2: a 7T fMRI study using a natural stimulus. Hum. Brain Mapp. 35, 213–226. https://doi.org/10.1002/hbm.22172
- Martuzzi, R., van der Zwaag, W., Dieguez, S., Serino, A., Gruetter, R., Blanke, O., 2015. Distinct contributions of Brodmann areas 1 and 2 to body ownership. Soc. Cogn. Affect. Neurosci. 10, 1449–1459. https://doi.org/10.1093/scan/nsv031
- Narsude, M., Gallichan, D., van der Zwaag, W., Gruetter, R., Marques, J.P., 2016. Three-dimensional echo planar imaging with controlled aliasing: A sequence for high temporal resolution functional MRI. Magn. Reson. Med. 75, 2350–2361. https://doi.org/10.1002/mrm.25835
- Oliveira, Í.A.F., van der Zwaag, W., Raimondo, L., Dumoulin, S.O., Siero, J.C.W., 2020. Comparing hand movement rate dependence of cerebral blood volume and BOLD responses at 7T. NeuroImage 226, 117623. https://doi.org/10.1016/j.neuroimage.2020.117623
- Oliveira, Í.A.F., Roos, T., Dumoulin, S.O., Siero, J.C.W., van der Zwaag, W., 2021. Can 7T MPRAGE match MP2RAGE for gray-white matter contrast? NeuroImage 240, 118384. https://doi.org/10.1016/j.neuroimage.2021.118384
- Oliveira, Í.A.F., Siero, J.C.W., Dumoulin, S.O., van der Zwaag, W., 2022. Improved Selectivity in 7 T Digit Mapping Using VASO-CBV. Brain Topogr. https://doi.org/10.1007/s10548-022-00932-x
- Oliveira, Í.A.F., Cai, Y., Hofstetter, S., Siero, J.C.W., van der Zwaag, W., Dumoulin, S.O., 2022. Comparing BOLD and VASO-CBV population receptive field estimates in human visual cortex. NeuroImage 248, 118868. https://doi.org/10.1016/j.neuroimage.2021.118868
- Priovoulos, N., Roos, T., Ipek, Ö., Meliado, E.F., Nkrumah, R.O., Klomp, D.W.J., Zwaag, W. van der, 2021. A local multi-transmit coil combined with a high-density receive array for cerebellar fMRI at 7 T. NMR Biomed. n/a, e4586. https://doi.org/10.1002/nbm.4586
- Priovoulos, N., Andersen, M., Dumoulin, S.O., Boer, V.O., van der Zwaag, W., 2023a. High-Resolution Motion-corrected 7.0-T MRI to Derive Morphologic Measures from the Human Cerebellum in Vivo. Radiology 220989. https://doi.org/10.1148/radiol.220989
- Priovoulos, N., de Oliveira, I.A.F., Poser, B.A., Norris, D.G., van der Zwaag, W., 2023b. Combining arterial blood contrast with BOLD increases fMRI intracortical contrast. Hum. Brain Mapp. 44, 2509–2522. https://doi.org/10.1002/hbm.26227
- Protopapa, F., Hayashi, M.J., Kulashekhar, S., van der Zwaag, W., Battistella, G., Murray, M.M., Kanai, R., Bueti, D., 2019. Chronotopic maps in human supplementary motor area. PLoS Biol. 17, e3000026. https://doi.org/10.1371/journal.pbio.3000026
- Raimondo, L., Heij, J., Knapen, T., Dumoulin, S.O., van der Zwaag, W., Siero, J.C.W., 2023a. Towards functional spin-echo BOLD line-scanning in humans at 7T. Magma N. Y. N. https://doi.org/10.1007/s10334-022-01059-7
- Raimondo, L., Knapen, T., Oliveira, Ĺ.A.F., Yu, X., Dumoulin, S.O., van der Zwaag, W., Siero, J.C.W., 2021. A line through the brain: implementation of human line-scanning at 7T for ultra-high spatiotemporal resolution fMRI. J. Cereb. Blood Flow Metab. Off. J. Int. Soc. Cereb. Blood Flow Metab. 41, 2831–2843. https://doi.org/10.1177/0271678X211037266
- Raimondo, L., Priovoulos, N., Passarinho, C., Heij, J., Knapen, T., Dumoulin, S.O., Siero, J.C.W., van der Zwaag, W., 2023b. Robust high spatio-temporal line-scanning fMRI in humans at 7T using multi-echo readouts, denoising and prospective motion correction. J. Neurosci. Methods 384, 109746. https://doi.org/10.1016/j.jneumeth.2022.109746
- Reynaud, O., Jorge, J., Gruetter, R., Marques, J.P., van der Zwaag, W., 2017. Influence of physiological noise on accelerated 2D and 3D resting state functional MRI data at 7 T. Magn. Reson. Med. 78, 888–896. https://doi.org/10.1002/mrm.26823
- Salomon, R., Darulova, J., Narsude, M., van der Zwaag, W., 2014. Comparison of an 8-channel and a 32-channel coil for high-resolution FMRI at 7 T. Brain Topogr. 27, 209–212. https://doi.org/10.1007/s10548-013-0298-6
- van der Zwaag, W., Francis, S., Head, K., Peters, A., Gowland, P., Morris, P., Bowtell, R., 2009. fMRI at 1.5, 3 and 7 T: characterising BOLD signal changes. NeuroImage 47, 1425–1434. https://doi.org/10.1016/j.neuroimage.2009.05.015
- van der Zwaag, W., Marques, J.P., Kober, T., Glover, G., Gruetter, R., Krueger, G., 2012. Temporal SNR characteristics in segmented 3D-EPI at 7T. Magn. Reson. Med. 67, 344–352. https://doi.org/10.1002/mrm.23007
- van der Zwaag, W., Kusters, R., Magill, A., Gruetter, R., Martuzzi, R., Blanke, O., Marques, J.P., 2013. Digit somatotopy in the human cerebellum: a 7T fMRI study. NeuroImage 67, 354–362. https://doi.org/10.1016/j.neuroimage.2012.11.041
- van der Zwaag, W., Gruetter, R., Martuzzi, R., 2015. Stroking or Buzzing? A Comparison of Somatosensory Touch Stimuli Using 7 Tesla fMRI. PloS One 10, e0134610. https://doi.org/10.1371/journal.pone.0134610
- van der Zwaag, W., Buur, P.F., Fracasso, A., van Doesum, T., Uludağ, K., Versluis, M.J., Marques, J.P., 2018a. Distortion-matched T1 maps and unbiased T1-weighted images as anatomical reference for high-resolution fMRI. NeuroImage 176, 41–55. https://doi.org/10.1016/j.neuroimage.2018.04.026
- van der Zwaag, W., Reynaud, O., Narsude, M., Gallichan, D., Marques, J.P., 2018b. High spatio-temporal resolution in functional MRI with 3D echo planar imaging using cylindrical excitation and a CAIPIRINHA undersampling pattern. Magn. Reson. Med. 79, 2589–2596. https://doi.org/10.1002/mrm.26906